Business Analytics: Forecasting with Seasonal Baseline Smoothing
This post was published 7 years ago. Download links are most likely obsolete. If that's the case, try asking the uploader to re-upload.

MP4 | Video: h264, 1280x720 | Audio: AAC, 48 KHz, 2 Ch
Genre: eLearning | Language: English + .SRT | + Exercise Files
Level: Advanced | Duration: 49m 39s | 110 MB
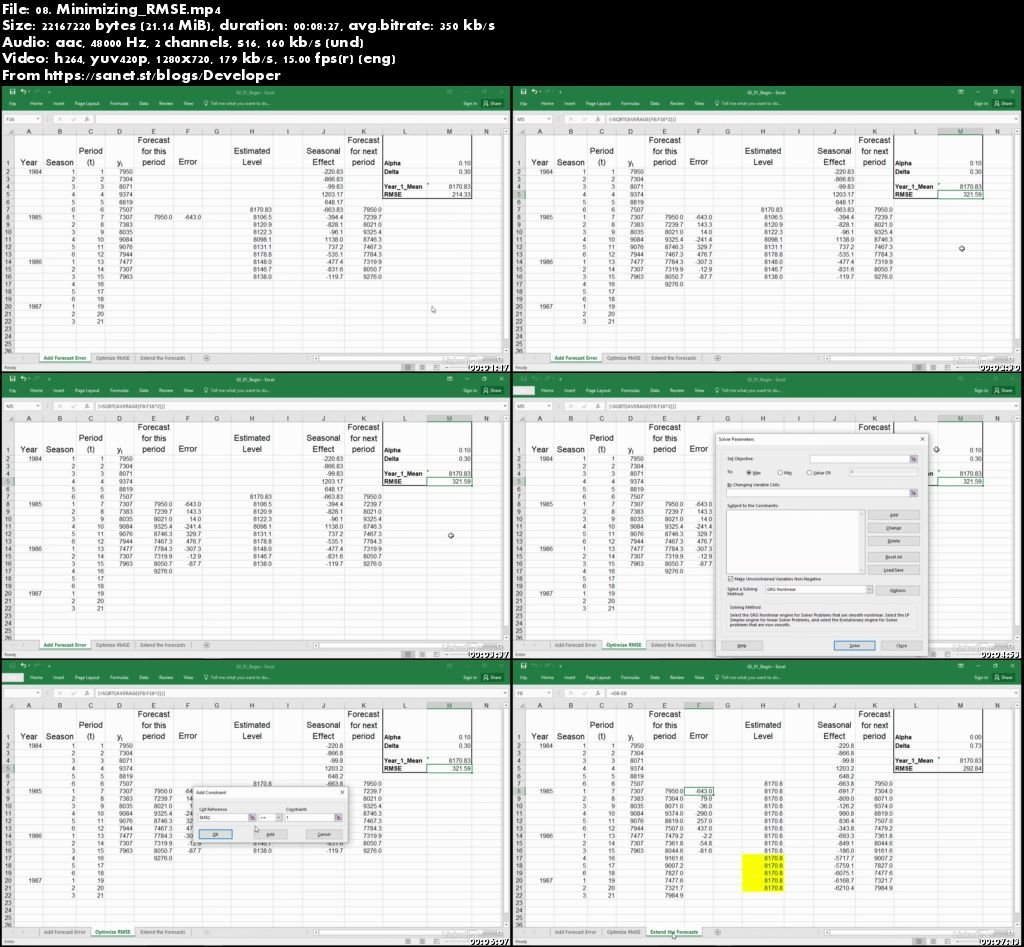
Seasonal exponential smoothing is an extension of simple exponential smoothing (SES). Seasonal smoothing is often used when a baseline shows regular seasonal peaks and valleys. Residential water usage is a familiar example: consumption rises during the summer and fall and drops during winter and spring—but the overall annual consumption tends to remain stationary over several years. In this course, veteran business analytics consultant and instructional expert Conrad Carlberg shows how to incorporate seasonal variation for more accurate and insightful forecasts. Learn how to identify seasonality, perform seasonal smoothing of horizontal baselines, and optimize your forecasts with R and Microsoft Excel.
Screenshots
Quick check before we show the links
Helps us keep automated scrapers from hammering the filehosts.