EE - Comparison Data Infographic PR4YHX8
AF, AI, EPS, TXT, PDF | 1366(w) × 768(h) px | 300 DPI | 8.39 MB
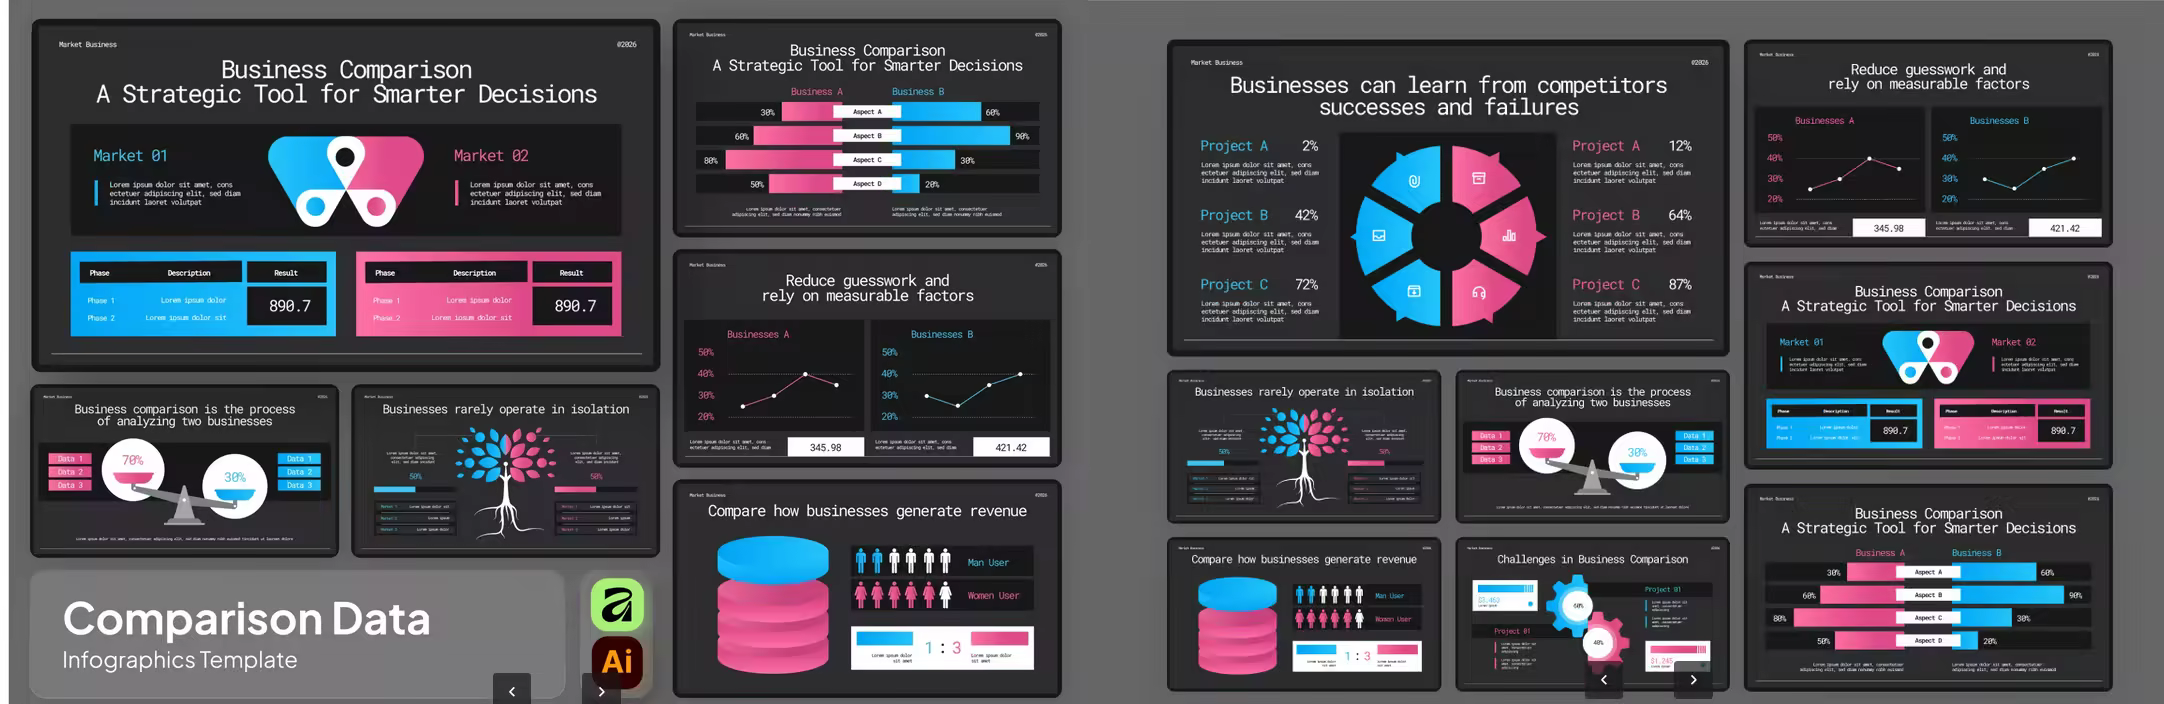
Comparison Data Infographic presents a modern and analytical design system for comparing business performance, market results, and strategic outcomes across multiple entities. The template features side-by-side layouts, bar and line charts, percentage indicators, tables, and visual comparison blocks that emphasize clarity and measurable insights. Designed with a dark interface and contrasting blue-pink accents, it delivers a professional, data-driven look that supports confident decision making. All elements are fully editable and structured for clear visual storytelling in presentations.
Relevance and Use Cases is perfect for business analysis reports, market comparison studies, competitor benchmarking, strategic planning sessions, executive presentations, performance evaluations, consulting materials, financial reviews, and data-focused pitch decks.
Features
8 Unique Infographic Elements
Available in AF, AI & EPS File Formats
100% Vector and Scalable
Organized Layers for Easy Editing
Fully Customizable
Free Fonts Included
What’s Inside the Package
Editable AF, AI and EPS Files
Help Guide to Get You Started
For the best editing experience, we recommend using Adobe Illustrator CC 2022 or later.
Quick check before we show the links
Helps us keep automated scrapers from hammering the filehosts.